Visualization - Maple Features - Maplesoft

Maple

Single User Licenses
Multi-User Licenses
Upgrade
What's New  |  Features  |  Online Demos  |  Compare  |  Training  |  Community  |  Free Trial  |  Buy Maple

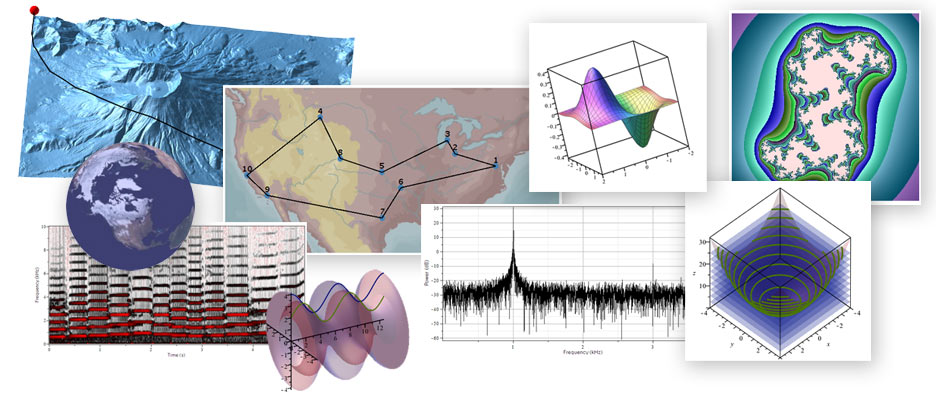
Maple provides an extensive suite of visualization tools. Create 2-D and 3-D plots and animations interactively using the Plot Builder Assistant and context-sensitive menus.  Maple also includes a large collection of commands and programming tools for plot creation and customization. These commands can be used interactively or included in Maple programs and scripts to create custom specialized plots and advanced applications.


Highlights:

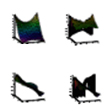
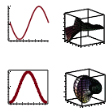
  • 2-D and 3-D graphs and animations
  • Over 200 plot types and options, including implicit, contour, complex, polar, vector field, conformal, density, ODE, PDE, and, statistical plots
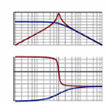
  • Engineering plots, including time and frequency domain responses and root-locus and root-contour plots
  • Wide variety of coordinate systems
  • Comprehensive Plotting Guide to plot types and options
  • Extensive customization and annotation tools
  • Layering of graphics and animations of different types
  • Standard geometric objects, regular solids, and polyhedra
  • Live Data Plots for creating and customizing statistical plots such as area charts, histograms, and pie charts
  • Smart plot view automatically focuses on the region of a 2-D plot that is more meaningful
  • Zoom and pan 2-D and 3-D plots and animations
  • Point probe for exploring the coordinates of 2-D plots
  • Real-time rotation of 3-D plots
  • Interactive control of parameters through slider controls
  • Add additional curves to a graph by dragging mathematical expressions into the plot region
  • Plot Builder Assistant for point-and-click creation and customization of many kinds of plots and animations
  • Modify plot options interactively using context-sensitive menus and toolbar buttons
  • Create and explore popular fractals, including the Mandelbrot, Julia, Newton, and other time-iterative
  • fractals.

Watch a Demonstration

Visualization is used extensively throughout the Maple demonstration movies. In particular, see:


  • Easy Plot Creation in Maple
    See how easy it is to create and customize plots in Maple using the interactive plot builder.

  • State-of-the-Art Visualization Capabilities
    Visualization is a powerful and indispensable tool for gaining insight into any modeling, simulation or analysis work. Maple makes visualizing your problems and solutions easy through its extensive plotting functionality. In this brief demonstration you’ll see how Maple can quickly produce professionally-rendered graphics to enhance your mathematical solutions.

  • Dynamic Plot Annotations in Maple
    In Maple, you can add dynamic plot annotations that will appear when you hover over specific points or curves, so you can convey even more information in your graphs.

  • Visualizing Maps and Geographic Data in Maple
    Map visualization tools and a geographical database in Maple let you explore and understand world data in a highly visual way.


Plotting in Maple

Maple includes many different 2-D and 3-D plots, which can then be further customized through a vast number of plotting options. You will find many of Maple's plot types below. For more information on plotting in Maple, see the Maple Plotting Guide


2-D Line Plots


Apply a gradient color scheme

Apply a gradient color scheme


Apply a gradient color scheme

Compare plots


Complex Plots

Complex Plots


Cumulative Sum Chart

Cumulative Sum Chart


Draw Geometric Object

Draw Geometric Object


Draw graph or network

Draw Graph or Network


Dual axis plot

Dual Axis Plot


Frequency plot

Frequency Plot


Infinity plot

Infinity Plot


Line chart

Line Chart


Logarithmic plot

Logarithmic plot


Parametric plot

Parametric plot


plot

Plot


Plot a discontinuous function

Plot a discontinuous function


Plot implicit function

Plot implicit function


Plot in different coordinate system

Plot in different coordinate system


Plot kernel density

Plot kernel density


Plot list of values

Plot list of values


Plot real curve

Plot real curve


Plot straight line

Plot straight line


Polar plot

Polar plot


2-D Filled Plots


Area chart

Area chart


Contour Plot

Contor Plot


Density Plot

Density Plot


Pie Chart

Pie Chart


Plot Inequality

Plot Inequality


Plot Polygon

Plot Polygon


Shade the area between two curves

Shade the Area Between Two Curves


Venn Diagram

Venn Diagram


Violin Plot

Violin Plot


2-D Vector and Grid Plots


Conformal Plot

Conformal Plot


Plot Direction Field

Plot Direction Field


Plot Field

Plot Field


Plot Gradient Field

Plot Gradient Field


Plot Spatial Curve

Plot Gradient Field


Plot Vector

Plot Vector


Plot Vector Field

Plot Vector Field


Show Coordinate System

Show Coordinate System


Space Curve

Space Curve


2-D Point Plots


Agglomerated Plot

Agglomerated Plot


Bubble Plot

Bubble Plot


Color Points by Associated Values

Color Points by Associated Values


Plot Quantile

Plot Quantile


Plot Sparse Matrix

Plot Sparse Matrix


Point Plot

Point Plot


Scatter Plot

Scatter Plot


Sunflower Plot

Sunflower Plot


Symmetry Plot

Symmetry Plot


Bar Plots


Bar Chart

Bar Chart


Box Plot

Box Plot


Column Graph

Column Graph


Error Plot

Error Plot


Histogram

Histogram


Pareto

Pareto


2-D Mathematical Concepts Calculated


FlowLine

FlowLine


Flux

Flux


Function Chart

Function Chart


Line Integral

Line Integral


Mean Value Theorem

Mean Value Theorem


Newton's Method

Newton’s Method


Path of a Stochastic Process

Path of a Stochastic Process


Plot Antiderivative

Plot Antiderivative


Plot Branches

Plot Branches


Plot DE Solution Cases

Plot DE Solution Cases


Plot Derivative

Plot Derivative


Plot Eigenvectors

Plot Eigenvectors


Plot Function Composition

Plot Function Composition


plot least squares fit

Plot Least Squares Fit


Plot linear System

Plot Linear System


Plot Linear Transform

Plot Linear Transform


Plot Newton Polygon

Plot Newton Polygon


Plot Phase Portrait

Plot Phase Portrait


Plot Projections

Plot Projections


plot Riemann Sum

Plot Riemann Sum


Plot Secant Line

Plot Secant Line


Plot Solution of ODE

Plot Solution of ODE


Plot Taylor Approximation

Plot Taylor Approcimation


Plot Vector Sum

Plot Vector Sum


Plot y=x reflection

Plot y=x Reflection


Poincare Surface of Section

Poincare Surface of Section


Point Interpolation

Point Interpolation


Probability Plot

Probability Plot


Process Control Chart

Process Control Chart


Profile of Likelihood

Profile of Likelihood


Rolle's Theorem

Rolle's Theorem


Root Locus Plot

Root Locus Plot


Tree Plot

Tree Plot


Venn Diagram

Venn Diagram


Wavelet Plot

Wavelet Plot


3-D Line and Point Plots


Agglomerated Plot

Agglomerated Plot


Draw Graph or Network

Draw Graph or Network


Plot 3-D Point

Plot 3-D Point


Plot Knot

Plot Knot


Space Curve

Space Curve


3-D Filled Plots


3-D Plot

3-D Plot


Apply Gradient Color Scheme to Surface

Apply Gradient Color Scheme to Surface


Area Chart

Area Chart


Color Surface by Associated Values

Color Surface by Associated Values


Color Surface by Coordinate Values

Color Surface by Coordinate Values


Compare Plots

Compare Plots


Complex Plot

Complex Plot


Contour Plot

Contour Plot


Draw Geometric Object

Draw Geometric Object


Implicit Plot

Implicit Plot


Plot Intersection

Plot Intersection


Plot Matrix Values

Plot Matrix Values


Plot Polyhedra

Plot polyhedra


Plot Tube

Plot Tube


Shade the Volume Between Two Surfaces

Shade the Volume Between Two Surfaces


Surface Plot Data

Surface Plot Data


3-D Vector and Grid Plots


3-D Plot in different coordinate system

3-D Plot in different coordinate system


Conformal Plot

Conformal Plot


Plot Field

Plot Field


Plot Gradient Field

Plot Gradient Field


Plot Spatial Curve

Plot Spatial Curve


Plot Surface

Plot Surface


Plot Vector

Plot Vector


Show 3-D Coordinate System

Show 3-D Coordinate System


3-D Mathematical Concepts Calculated


Directional derivative

Directional derivative


Flow Line

Flow Line


Flux

Flux


Gradient

Gradient


Lagrange Multipliers

Lagrange Multiploers


Line Intergral

Line Intergral


Normal

Normal


Plot Cross Product

Plot Cross Product


Plot Cross Section

Plot Cross Section


Plot DE Solution

Plot De Solution


Plot Eigenvectors

Plot Eigenvectors


Plot Least Squares Fit

Plot Least Squares Fit


Plot linear system

Plot linear system


Plot linear transform

Plot linear transform


Plot ODE Solution

Plot ODE Solution


Plot PDE Solution

Plot PDE Solution


Plot Projection

Plot Projection


Plot Riemann Sum

Plot Riemann Sum


Plot Surface/Volume of Revolution

Plot Surface/Volume of Revolution


Plot Taylor Approximation

Plot Taylor Approximation


Plot Vector Sum

Plot Vector Sum


Poincare Surface of Section

Poincare Surface of Section


Radius of Curvature

Radius of Curvature


Tangent Vector

Tangent Vector


TNB Frame

TNB Frame


Vector-defined Plane

Vector-defined Plane


Specialized Plots


Cayley Graph

Cayley Graph


Cayley Table

Cayley Table


Compare Plots in an Array

Compare Plots in an Array


Display Data on a World Map

Display Data on a World Map


Display Different World Map Projections

Display Different World Map Projections


Draw Graph

Draw Graph


Plot Vector

Plot Vector


Show 3-D Coordinate System

Show 3-D Coordinate System


Periodogram

Periodogram


Plot Polyhedral Set

Plot Polyhedral Set


Pressure-enthalpy

Pressure-enthalpy


Psychrometric Chart

Psychrometric Chart


SignalPlot

SignalPlot


Spectrogram

Spectrogram


Temperature-Entropy Chart

Temperature-Entropy Chart


Statistical and Financial Plots


3-D Agglomerated Plot

3-D Agglomerated Plot


3-D Area Chart

3-D Area Chart


Agglomerated Plot

Agglomerated Plot


Area Chart

Area Chart


Bar Chart

Bar Chart


Biplot

Biplot


Box Plot

Box Plot


Bubble Plot

Bubble Plot


Column Graph

Column Graph


Cumulative Sum Chart

Cumulative Sum Chart


Data Plot

Data Plot


Error Plot

Error Plot


Frequency Plot

Frequency Plot


Heat Map

Heat Map


Histogram

Histogram


Line Chart

Line Chart


 Pareto

Pareto


Path of a Stochastic Process

Path of a Stochastic Process


Pie Chart

Pie Chart


Plot Kernel Density

Plot Kernel Density


Plot Point

Plot Point


Plot Quantile

Plot Quantile


Probability

Probability


Profile of Likelihood

Profile of Likelihood


Scatter Plot

Scatter Plot


Scatter Plot 3-D

Scatter Plot 3-D


ScreePlot

ScreePlot


Seasonal Subseries Plot

Seasonal Subseries Plot


Sunflower Plot

Sunflower Plot


Surface Plot of Data

Surface Plot of Data


Symmetry Plot

Symmetry Plot


Time Series Plot

Time Series Plot


Tree Map

Tree Map


Tree Plot

Tree Plot


Venn Diagram

Venn Diagram


Violin Plot

Violin Plot


Weibull Plot

Weibull Plot


Dynamic Systems


Bode Plot

Bode Plot


Nichols Plot

Nichols Plot


Nyquist Plot

Nyquist Plot


Plot Discrete Points

Plot Discrete Points


Plot Impulse Response

Plot Impulse Response


Plot Magnitude

Plot Magnitude


Plot phase

Plot phase


Plot Response

Plot Response


Plot Response in 3-D

Plot Response in 3-D


Plot Zeros and Poles

Plot Zeros and Poles


Root-contour Plot

Root-contour Plot


Root-locus Plot

Root-locus Plot